A month without R# or Rider - General usability and code navigation
Why bother?
As long as I’ve been developing with Visual Studio, I remember I’ve been looking for add-ons to make me more productive. I think it started with Visual Assist in 2002. But right after I switched employers in 2004, I discovered JetBrains’ ReSharper. With improved Intellisense, the coloring of identifiers, the many built-in refactorings, it felt like a new world opened up to me. And over the years, JetBrains kept making it better and better. Every new release added a hoist of new options, and bugs were fixed quickly enough. And support was great, especially with some of the folks behind JetBrains being so visible on Twitter.
But I also noticed that with every new Visual Studio and ReSharper release the memory and CPU footprint increased a lot. And it wasn’t only me. More and more people in my network were considering to ditch ReSharper. But then, in 2016, JetBrains announced Rider, a full-blown IDE for .NET and C# developers based on there wildly successful IntelliJ IDE and all the power of ReSharper. The first versions were a bit rough on the edges. But by the end of 2017, I fully switched to Rider for all my development work, both professionally as well as for my open-source projects. I never looked back.
In the mean time, I regularly started to run into people that switched back to a bare-bones Visual Studio installation and told me that they didn’t miss anything. So I started to wonder. Did Visual Studio really get so much better since the last time I tried? Did Microsoft finally get the message and pick up the pace in building a productive IDE? I also noticed clients wondering why they needed to invest in anything but Visual Studio. To see how much Microsoft has evolved, I decided to try it myself. I installed a fresh installation of Visual Studio 2019 Professional (version 16.5.4) with just the free Productivity PowerTools and the Github Extension for Visual Studio, and used it for a full month.
Opening your favorite solution and selecting the right branch
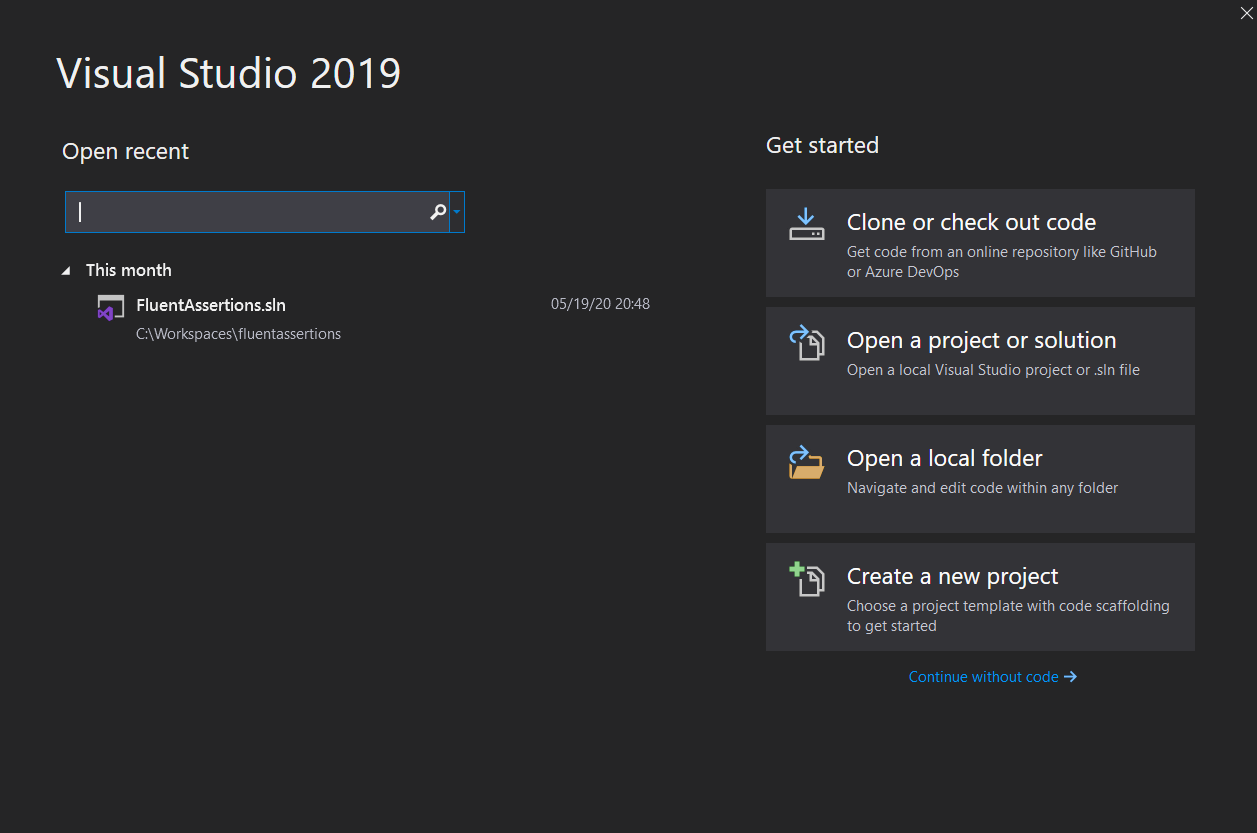
To put things in the right perspective, I’ve tried to organize my experiences around a typical developer workflow. This all starts with launching Visual Studio, so that’s what I did. The first thing I noticed is that the initial Open Project popup appears quite quickly, much faster than with previous versions. Only after you select a project or solution such as FluentAssertions in my case, it loads the actual IDE. I guess it is already preparing things in the background, but it does make it feel quite responsive. To confirm that this is not just an illusion, I did use a stopwatch and concluded that loading the same solution is faster in Visual Studio than in Rider.

I’m confident that this will not remain like that, considering the plans JetBrains has to adopt .NET Core for its backend. While loading a solution, they both display notifications about some background processing that is still happening, but Rider’s notifications are more detailed (and useful). Compared to the many default toolbars and tool windows of Rider, the Visual Studio IDE looks a bit cleaner and less cluttered. However, those few toolbars and tool windows that are there by default take quite a lot of space, leaving less real estate than Rider offers. Especially while working on a laptop, every bit of room should be available to you.
In terms of responsiveness and memory footprint, Rider is a clear winner. The number of times the UI locks up reminds me of those old Windows Forms applications where people forgot that they shouldn’t run long-running operations on the UI thread. Surely the team behind Visual Studio know about those pitfalls too, right? Also, working with the Visual Studio IDE is quite a sluggish experience compared to the snappiness of Rider. This is particular noticeable when you switch branches using Git and touching project or solution files. The entire UI will lock up for half a minute while Visual Studio is reloading the solution. Two years ago, this was one of the main reasons that made me decide to switch to Rider. It reloads any changes in the background without barely noticeable effects. But that’s not all.
Since I’m involved in building multiple libraries and services, at any given time, I work with multiple smaller solutions at the same time. This is practically impossible to do with Visual Studio. You simply can’t run multiple instances of Visual Studio on anything but a very beefy machine. But with Rider, another solution is just another window within the same process. It even asks you whether you want to open that new solution in the same window or a new one. And even though Rider spawns new background processes for every new solution, I’ve never noticed this having any affect on my older laptop.
Finding your way through the code
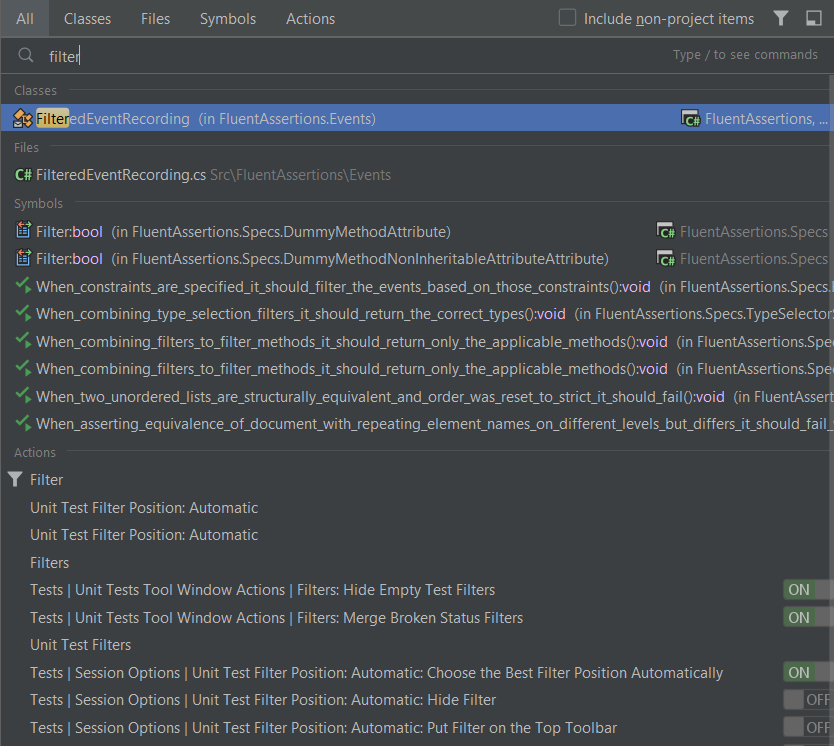
Whether or not you were planning to continue working on your own code, doing a code review or just drilling down through an existing code base, after loading the solution and selecting the right branch, you’re inevitably going to be using the navigating features of your IDE. If you use the ReSharper Keyboard map, this all starts with using CTRL-T to find a file, type, member or symbol. And the first thing I noticed is that CTRL-T in VS will list the same type for every framework it targets and completely ignores the target you’ve selected if you already had a file open, something that Rider gets much better. In fact, the latter will even take into account the files you’ve been looking at most recently. So if I was editing FilteredEventRecording.cs and then use the phrase filter in the CTRL-T popup, VS will first list the types which start with that keyword instead of first showing that recent file like Rider does.

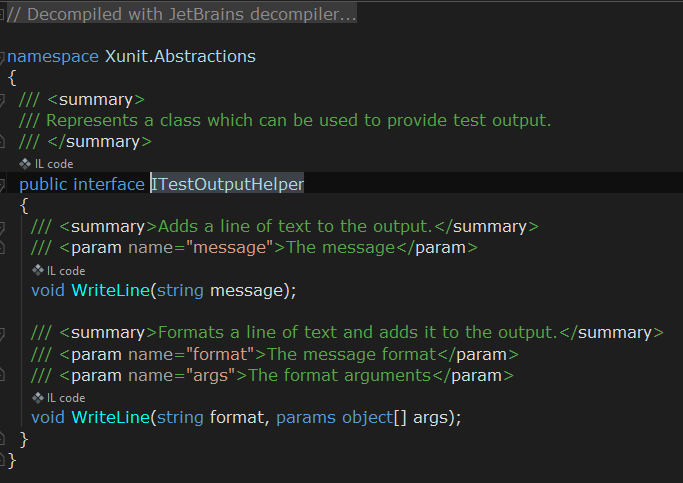
But these are all minor nuisances. The real disappointment comes when you go to the definition of an external class or interface, e.g. using F12 or using the left mouse button. If you’re lucky and the external library has source symbols available on the internet, you get to see the internals of that code. But if not, and that’s the majority of the cases, you just get a definition of that type. JetBrains has been well-known for its assembly decompiler, DotPeek, and it’s all built in Rider. So the first time you try to go the definition of an external library, Rider will ask you whether it should try to get the symbol files or just fall back to its built-in decompiler. In my case, the latter is always the fastest option. And it doesn’t stop there. You can continue using all the navigation options on those decompiled definitions as well. You want to know what code in your project implements xUnit’s ITestOutputHelp? Just press CTRL-END and you’re good to go.

Another major annoyance is that in VS there’s no easy keyboard shortcut to jump to a particular member of the current type, an attribute or element of an XML file, etc. In Rider, ALT-\ is my big friend. It works everywhere, including base-classes, and non-code files such as XML and JSON. I was so surprised that something trivial like this still does not exist in Visual Studio.

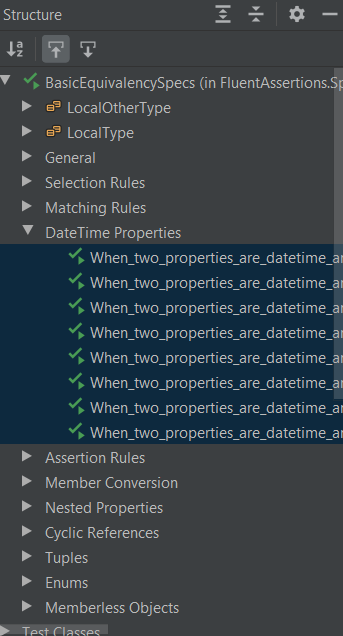
Since I care about the structure of my file and the order of the members, I always have a view of that file docked to the right side of my IDE. Unfortunately, VS does not have anything like that, unless you’ve installed ReSharper. In the case of Rider (or ReSharper), if that file is a unit test class, it will also show you the success or failure status of each test.

Another usability issue Visual Studio has, is the way it deals with finding stuff. There’s no way to quickly list all usages in a popup, select the item you’re interested in and navigate to that symbol or file, just using the keyboard. You always end up with another panel that you need to manually close. Same with finding the implementation of an interface or an override of a virtual member. In Rider, I always use the popup version to quickly find what I’m looking for. Only if I want to see keep all results, I use the option to open the result in a separate panel.

Although a minor issue, I did miss some features while navigating my code base. For example, Visual Studio misses the ability to find the source or the destination of an argument or parameter, finding the APIs that expose or consume a specific type, or finding the other overloads of the same method. And I’m sure there’s a lot more than I have been taking for granted.
This was part 1 of my little experiment. Next time I’ll talk about my editing and debugging experiences in Visual Studio. But for now, what do you think? Do you have similar experiences? Or do you not see the added value of any of these tools and remain with a plain old Visual Studio? Let me know by commenting below. Oh, and follow me at @ddoomen to get regular updates on my everlasting quest for suggestions and ideas to become a better professional.

 Aviva Solutions
 Fluent Assertions
Leave a Comment